Moving towards CQI to improve accreditation outcomes with Analytics by Acuity Insights

November 18, 2020
Having insight into where your data originates and the types of data you need to collect just begins to scratch the surface of continuous quality improvement (CQI). The large amounts of data available and constantly being collected in just one system, like Acuity, can be daunting. Add in the other data sources like USMLE results, internal exam scores, student information system details and where they intersect with accreditation standards, and it can seem impossible to get the oversight needed to make sense of the data and truly drive a successful CQI process.
By starting with Acuity’s tools to help simplify MedEd management you can add clarity to your data, map it to the standards required by accrediting bodies, and make it understandable and actionable to your stakeholders.
But how do you make sense of the data and begin to drive true CQI?
1. Start with where, who, and when
First, determine where the data will be reviewed. Which meetings will include discussion of segments of your data and review? Who is responsible for specific accreditation elements like curriculum and which segments of the data are related to their review? How often will a review be included in the meeting discussion?
Establishing the responsibility and rhythms for CQI review are the first step.
2. Get into the what; set a goal
Identify an area of specific concern, for example, one that was flagged in your most recent accreditation review. Then, determine the data available for that specific area to be addressed. Perhaps there are gaps in the data that can be solved first. Identify a goal to be addressed within that key area. This will offer the foundation needed to dig in further.
3. Finally – how to get a clear view
Some of the data you’ll need to review will be appropriate for viewing in a dashboard. With Acuity Analytics, data from multiple systems or data sources can be pulled in. This will allow you to see the data in a unified view on easy-to-use dashboards.
Here are some specific examples that address a particular DCI accreditation element and how they can be viewed using multiple data sources:
Example 1: Review learning objectives by competency
Liaison Committee in Medical Education (LCME) Element 6.1 on Program and Learning Objectives requires a medical school to “define its medical education program objectives in outcome-based terms that allow the assessment of medical students’ progress in developing the competencies that the profession and the public expect of a physician. The medical school makes these medical education program objectives known to all medical students and faculty. In addition, the medical school ensures that the learning objectives for each required learning experience (e.g., course, clerkship) are made known to all medical students and those faculty, residents, and others with teaching and assessment responsibilities in those required experiences.” [LCME, 2018]
In this example, let’s review patient care and clinical skills. These two competencies can be explored in each review meeting after new scores are collected.
Take a look at the clinical skills competency by examining student performance in OSCEs both by clerkship and across campuses:
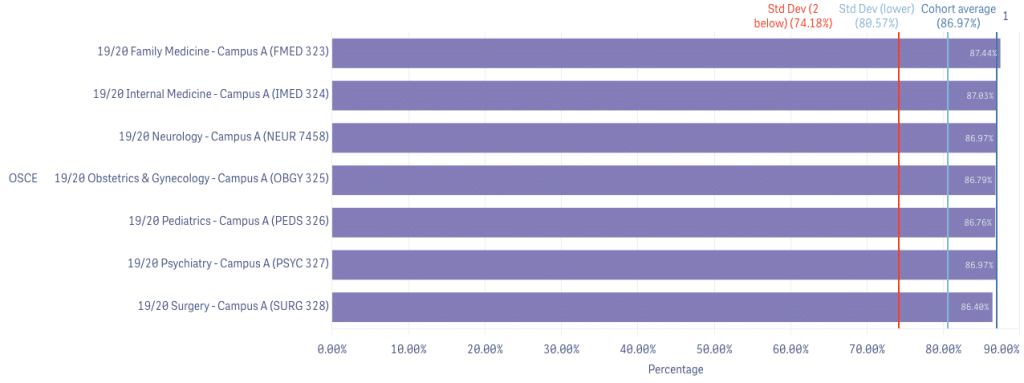
Review overall performance by clerkship. Below you can see above-average failing grades in the Surgery clerkship at Campus A and be able to dive into the Surgery data further.
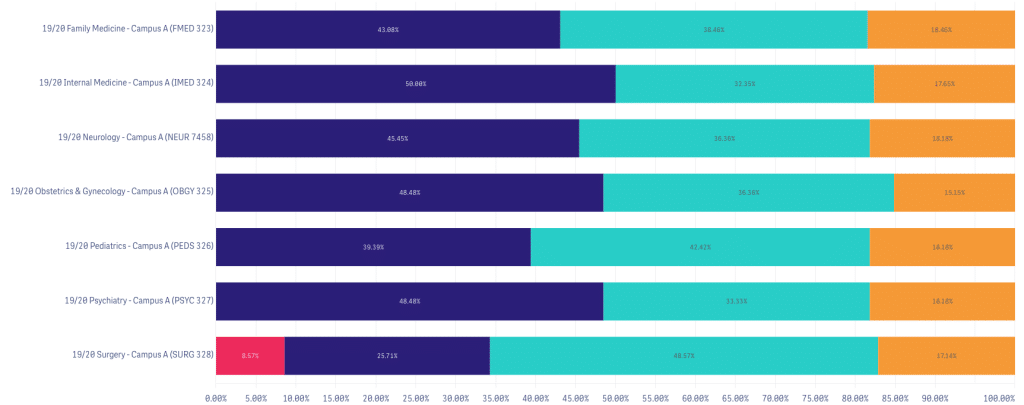
Example 2: Review Learning Experiences
Liaison Committee in Medical Education (LCME) Element 6.3 on Self-Directed and Life-Long learning requires a medical school to “ensure that the medical curriculum includes self-directed learning experiences and time for independent study to allow medical students to develop the skills of lifelong learning. Self-directed learning involves medical students’ self-assessment of learning needs; independent identification, analysis, and synthesis of relevant information; and appraisal of the credibility of information sources.” [LCME, 2018]
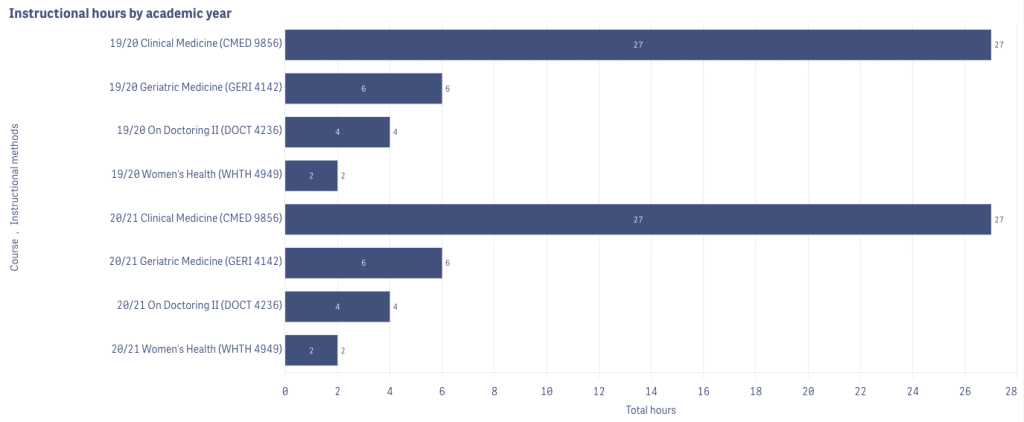
Having the ability to see instructional hours across specific courses, and instructional methods across academic years empowers a review of where faculty are spending their time and if this meets expectations and requirements.
Example 3: Comparing education and assessment experiences
Liaison Committee in Medical Education (LCME) Element 8.7 on Comparability of Education/Assessment requires that a medical school “ensures that the medical curriculum includes comparable educational experiences and equivalent methods of assessment across all locations within a given course and clerkship to ensure that all medical students achieve the same medical education program objectives.” [LCME, 2018]
Being able to see your course and clerkship data from all sources across sites, campus, and academic years can give you powerful insights to address issues, and illustrate how you flagged and resolved issues to accreditors.
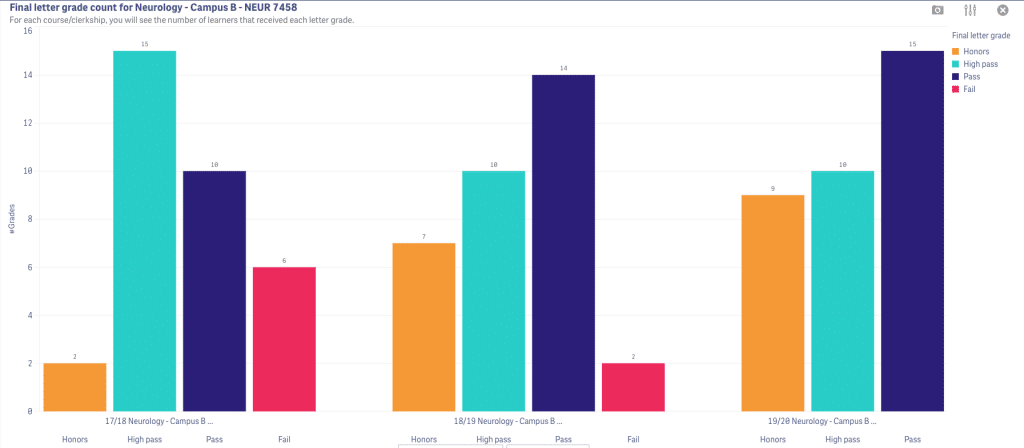
In this dashboard example we see there is an issue with failing learners in Neurology at Campus B.
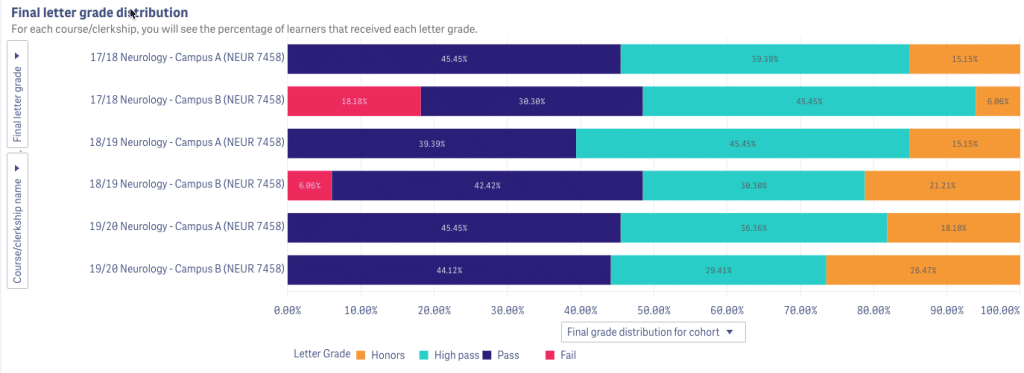
We can further dive into the results from the Neurology course at Campus B by looking at the grade distribution across academic years and see the 2017-18 cohort had a much higher fail rate that improved in 2018-19, and was resolved in the 2019-2020 academic year.
Starting with identifying who needs to review the data, where that review will take place and which critical area to address means the cycle for CQI at your institution is now defined. Add in the power of visualizing data on dashboards, like in Analytics, and your teams will get the critical insight they need.
Related Articles

How interviews could be misleading your admissions...
Most schools consider the interview an important portion of their admissions process, hence a considerable…
Reference letters in academic admissions: useful o...
Because of the lack of innovation, there are often few opportunities to examine current legacy…
