2020 Update on Analytics at Altus

November 12, 2020
Our vision for Altus Analytics is to improve the success of both educators and learners by providing access to the data necessary to make positive changes at every level of the learning experience. Analytics has grown a lot over the last year as we have relentlessly focused on improving in two key areas:
- Add more data to the system.
- Organize the data to answer questions about how your program and learners are performing.
New data sources
Exam data – ExamSoft and NBME CAS
The first data integration we built in 2020 was with ExamSoft. Exam data is a key measure of both how well your program is running and how well your students are performing. Adding this valuable exam data to Analytics has been a big win for Analytics and our customers.
After the initial release, we added and have refined the capability to import question categories from ExamSoft. This enables novel ways of viewing and comparing performance across exams, within a course, and across years. Reporting that was laborious to produce, but is now accessible in seconds.
Many institutions use the NBME CAS exam platform in addition to, or instead of ExamSoft. Using the knowledge we gained from our work with ExamSoft, we added an integration with the NBME to pull CAS exam data from their system. If your institution is one that uses both platforms for exams, this is a big win as you can now compare exams from both systems in one place.
Gateway exams
“Gateway exams,” including CBSE, Step 1, CCSE, and Step 2 are important predictors of learner success as they progress through their medical education. As 2020 was dawning, we were manually importing results for gateway exams and had limited reporting capabilities.
Working closely with the NBME, we built integrations for all of these gateway exams. Where the manual imports would soon grow stale, we now pull the results as they are made available by the NBME. Senior faculty and administrative staff can now find out how learners performed on these exams without having to wait.
Course evaluations
Course evaluations data, including both quantitative and qualitative responses are imported from the Altus Assessment module. This data is essential to report on LCME standard 8.5 – Medical Student Feedback. Course and program directors that we work with also review the data on a regular basis to find out how learners perceive the courses they are taking.
We have since added the ability to embellish course evaluation data, allowing customers to add questions on their evaluations to categories. These categories provide new dimensions on which to organize and examine the data.
Course composition
Our course composition integration uses the Altus Curriculum module to import information about your curriculum into Analytics. The data can be used to report on instructional hours and instructional methods along many dimensions including academic year, phase, or course.
Customers can use the data to report on LCME standards 8.3 – Curricular Design, Review, Revision/Content Monitoring and 8.8 – Monitoring Student Time.
Admissions data
Admissions data can provide interesting insights into the makeup of your student body. If you want to track which students matriculated from a special program, our admissions data integration puts this information into the hands of people who haven’t always had easy access.
This year we standardized how we gather and report on admissions data, adding many new fields so you have a better understanding of who your learners are. Customers have also shared how they are using admissions data to segment other kinds of reporting, unlocking new possibilities for performance comparison based on different personal characteristics.
Automated file imports through our flexible SFTP integration
Last year, our big focus was on importing grades data into Analytics. We set up integrations with Canvas, and with the Altus Assessment module to import and report on grades. This year we expanded the capacity for grades reporting in Analytics by setting up a system to automate importing grades data from spreadsheet files shared through a secure FTP connection.
Importing directly from files solves the common problem of importing grades that aren’t stored in the system of record. For some customers this means importing grades exported from a home-grown grades management tool, and for others it means importing ad hoc grades that aren’t captured in a big system.
We automated the process for importing the files and designed the integration to be flexible, accommodating different formats, to make the process as seamless as possible.
Organize the data to answer questions about how your program and learners are performing
Once we have the data in Analytics, the fun part is working with our customers to find all the ways they want to use the data, and to see how they approach answering common questions about how their programs and learners are performing.
Some themes we have seen and worked to address in Analytics include:
- review new data when it comes in
- get an overview of how a learner has performed with the ability to do a deep dive into their performance when required
- get an overview of how a course has performed with the ability to take a closer look and compare to previous years
- find potentially struggling students, or at-risk students
- export data for ad hoc analysis
Review new data when it comes in
Everyone is anxious when new data gets collected. The first questions are nearly always “how did we do?” or “is there anything I need to be worried about?”
We added new dashboards and visualizations that highlight newly added data in Analytics. Our recent exam performance and recent gateway data dashboards let you quickly scan and review the most up-to-date results. When new exam data comes in you quickly see how a cohort performed on that exam and find performance outliers.
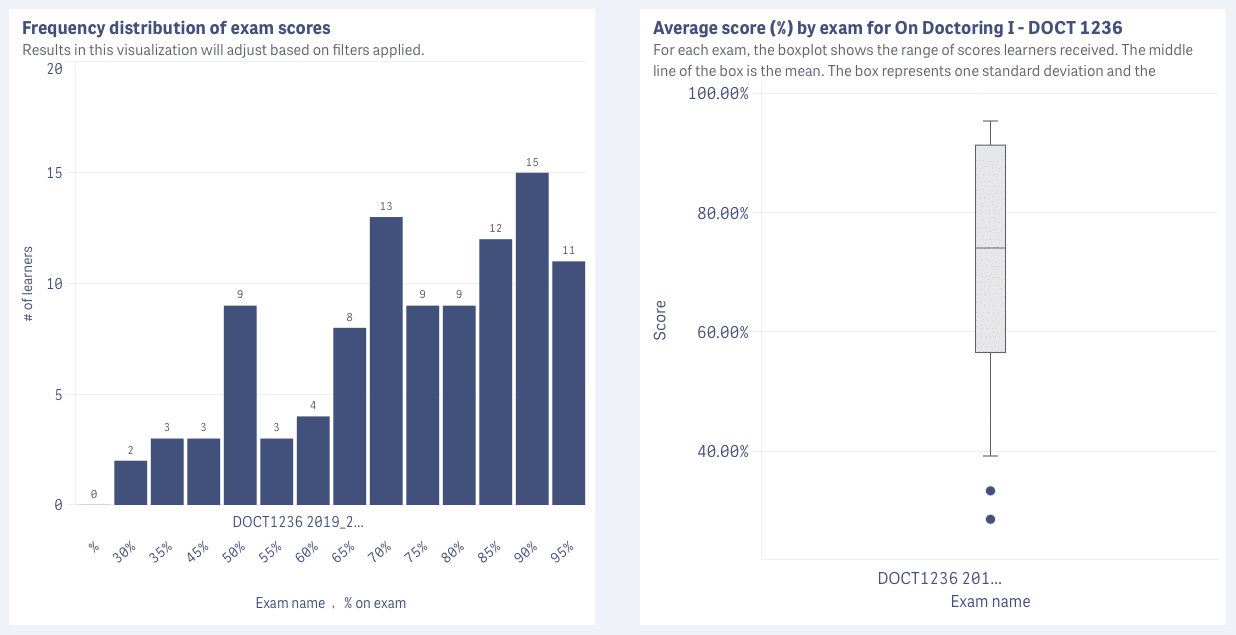
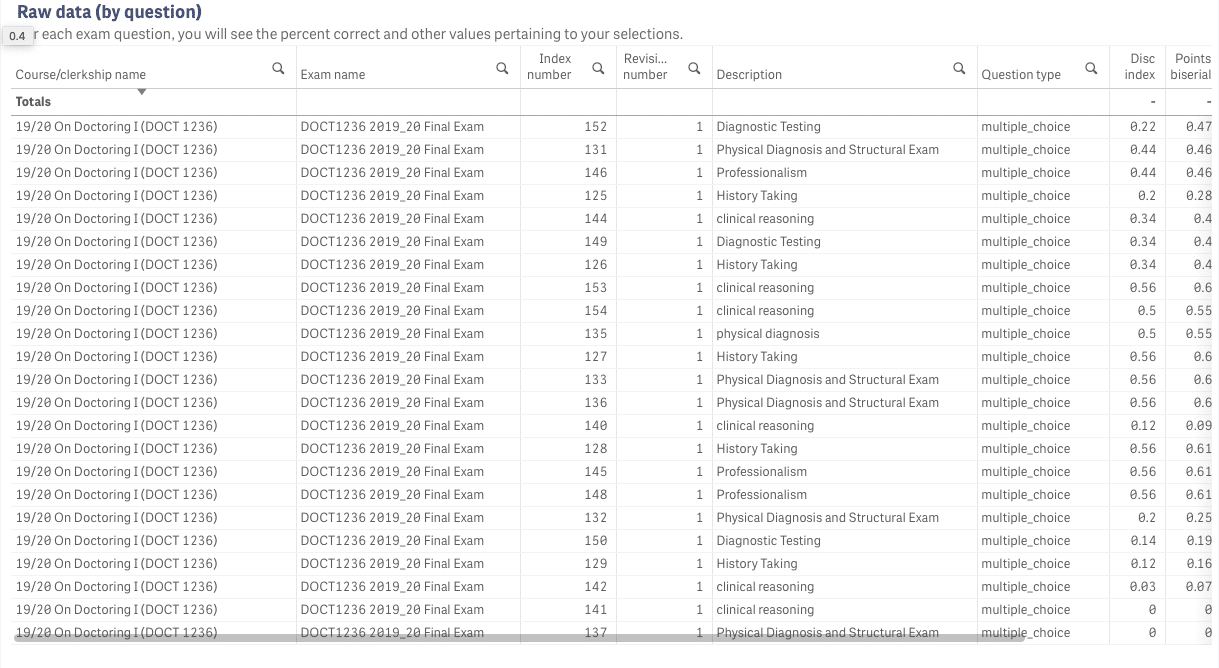
When you need to, you can dive in further. For example, on a recent exam Analytics provides data at the question level where you can review statistical information such as Discrimination index and Points biserial to understand the validity of the questions on your exams. This will tell you if you need to make any adjustments for questions that are too difficult, confusing, or too easy.
Get an overview of how a learner or course has performed
As we added new data sources to Analytics, we got requests asking us to combine data from different sources into unified dashboards. The feedback was clear: we needed to add dashboards that provided an overview of how a learner or course is performing.
We heard that 95 percent or more of the time everyone (and everything) is doing fine. For these people and courses you need to look at the most important data from each source, verify that everything looks good, and move on. To simplify this process, we re-organized and updated the Learner and Course summary dashboards to provide a starting point for reviewing learner and course performance.
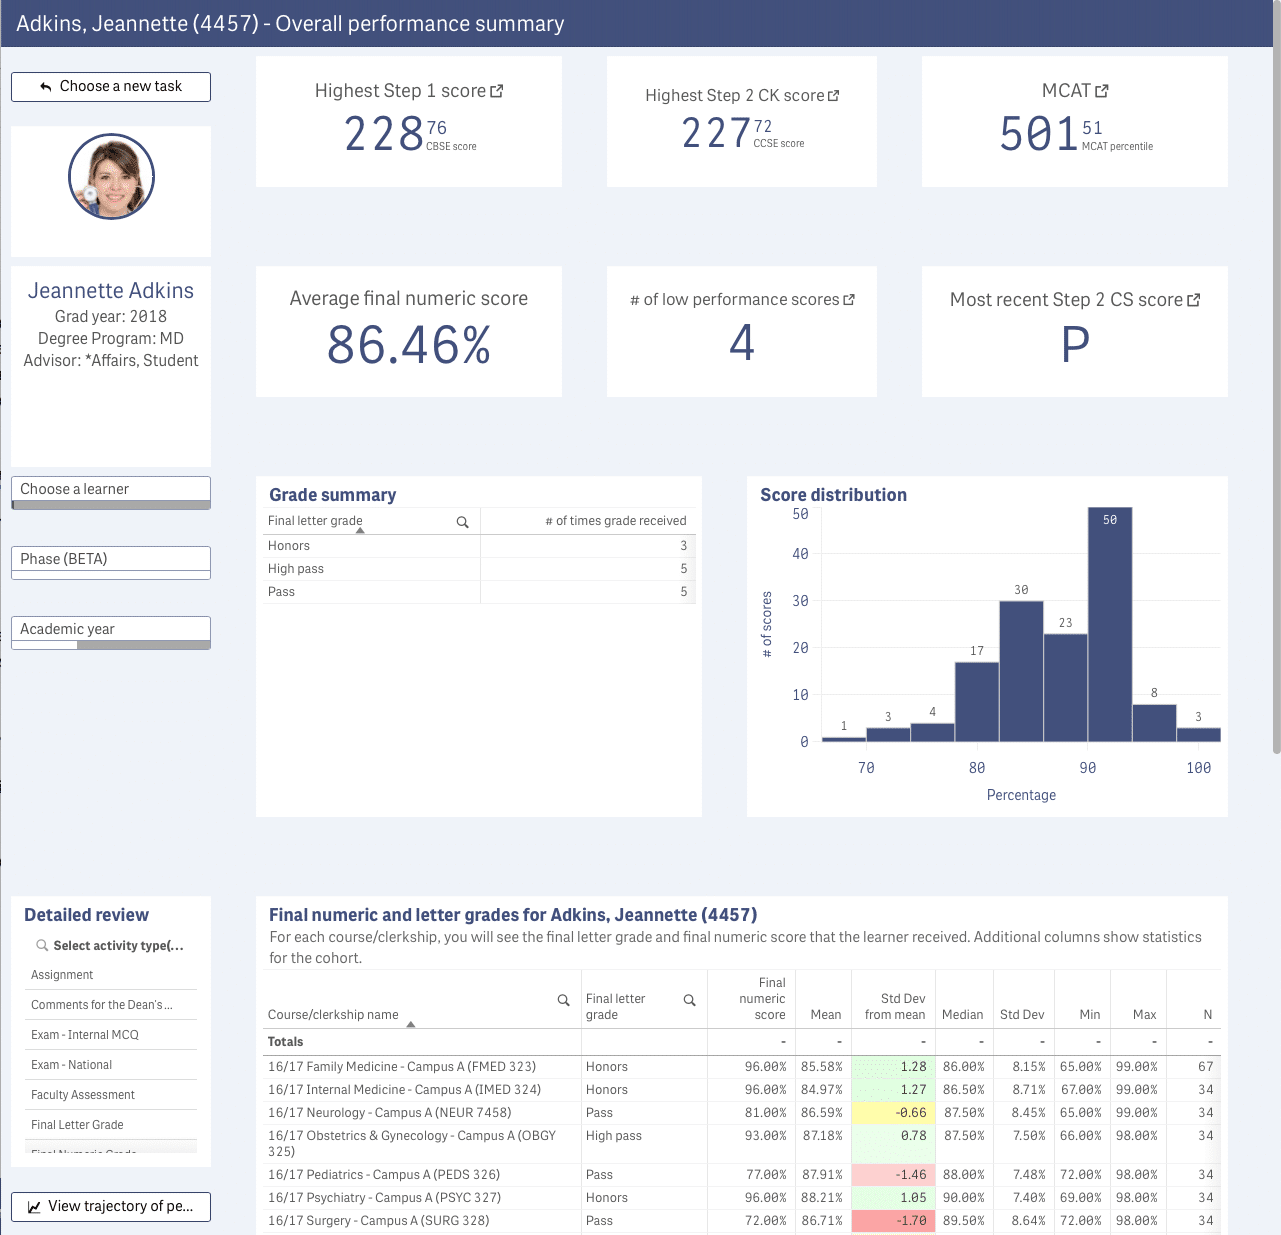
On the Learner summary dashboard we start with a photo of the learner and some details about their grad year, degree program, advisor, and campus. From one place you can review the details of how a learner performed on the MCAT, their Step exams, and grades.
The course review dashboard also consolidates data. Here we combine grades, student feedback, course composition, and exam data on the same dashboard. In each section you can jump to dashboards that contain more detailed information depending on the type of review or analysis you need.
Perform a deep dive into the performance of a learner or course
Adding more links between dashboards is just one way we have made it easier to dive deeper into the data. We have also added new dashboards that allow you to dive into a specific data source. These detailed dashboards provide more space to look at the data in different ways, and with different types of visualizations.
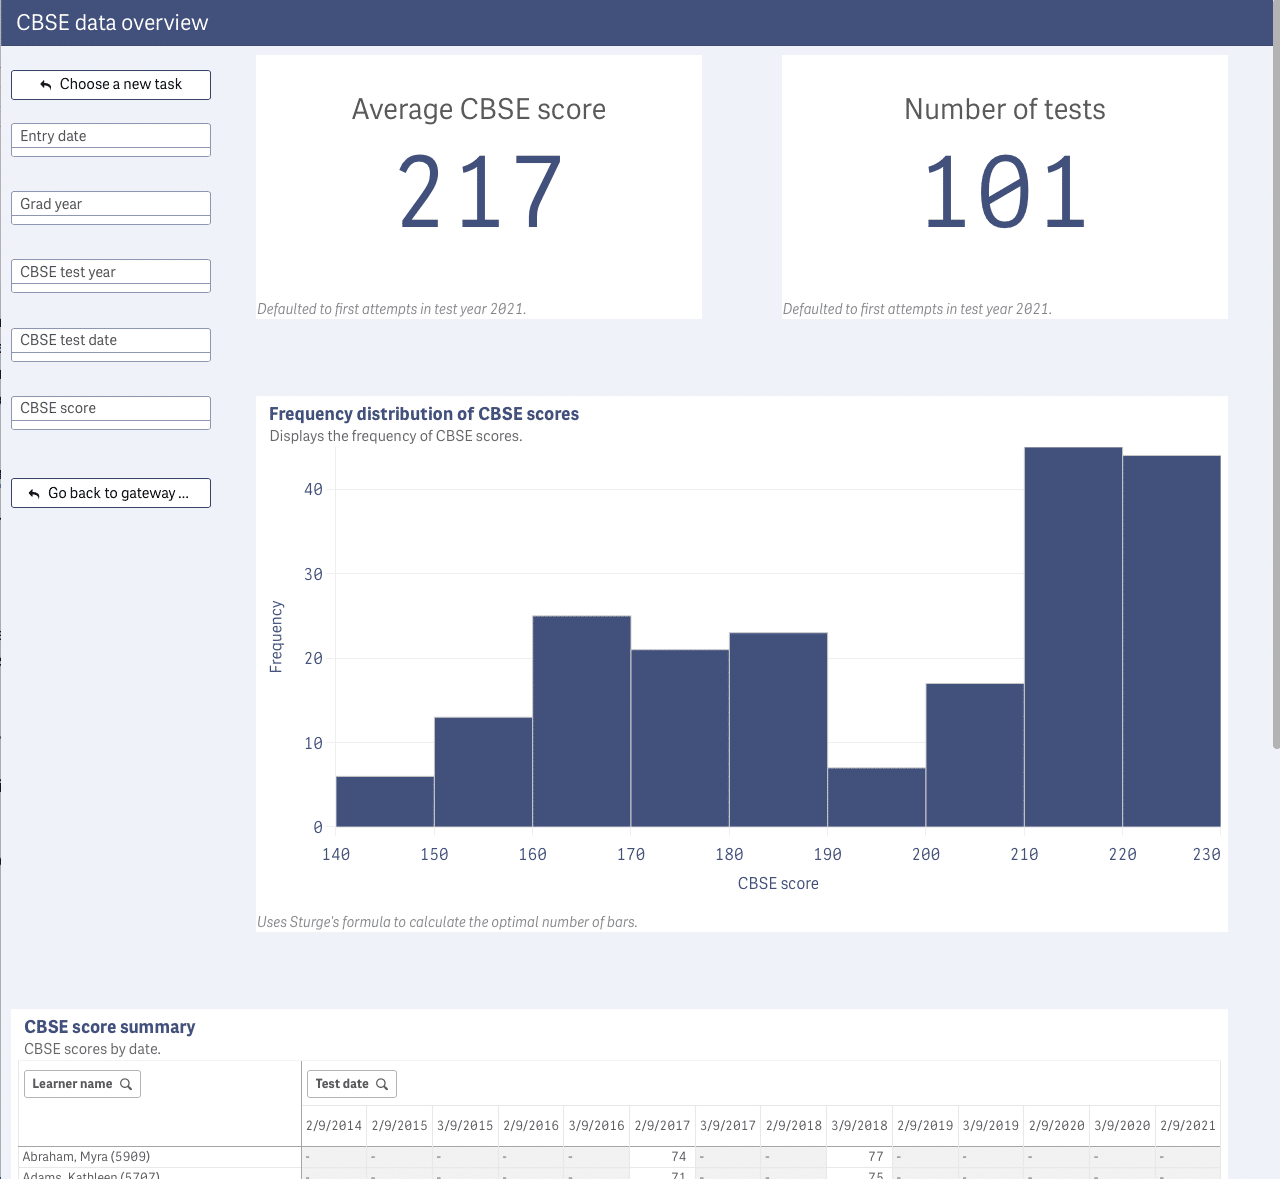
The new and updated deep-dive dashboards include visualizations that compare data. For example, on our CBSE dashboard we added a comparison of CBSE to Step 1 scores. We added a similar comparison of your institutional Step scores to national averages on our Step 1 dashboard.
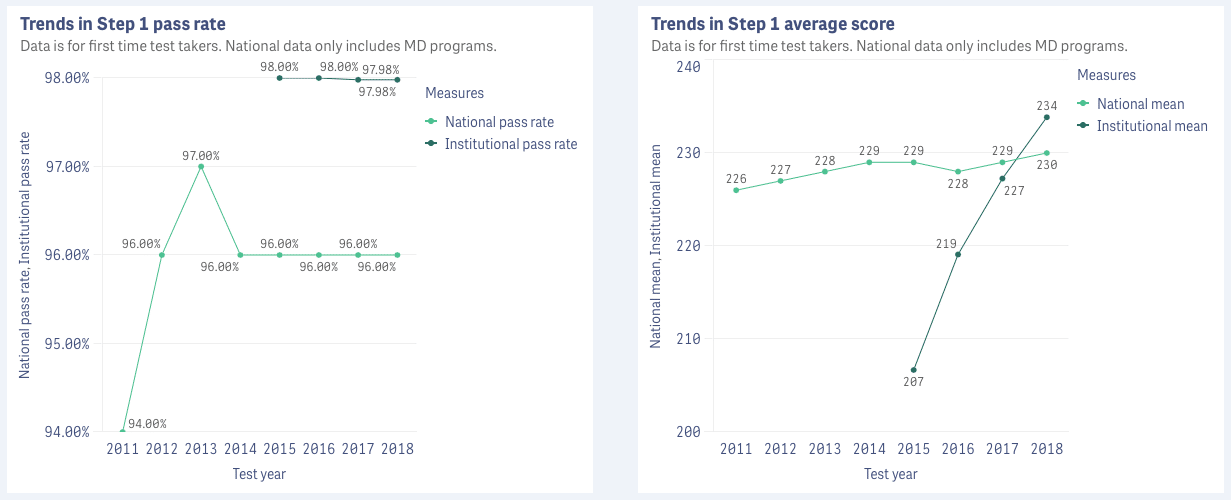
When you need to do a detailed analysis, our approach is to let you review data in multiple ways. If you prefer to look at data in a table, we have you covered with tables you can look at. If you prefer to look at the data more visually, we have charts that tell the story of the data in the clearest way possible.
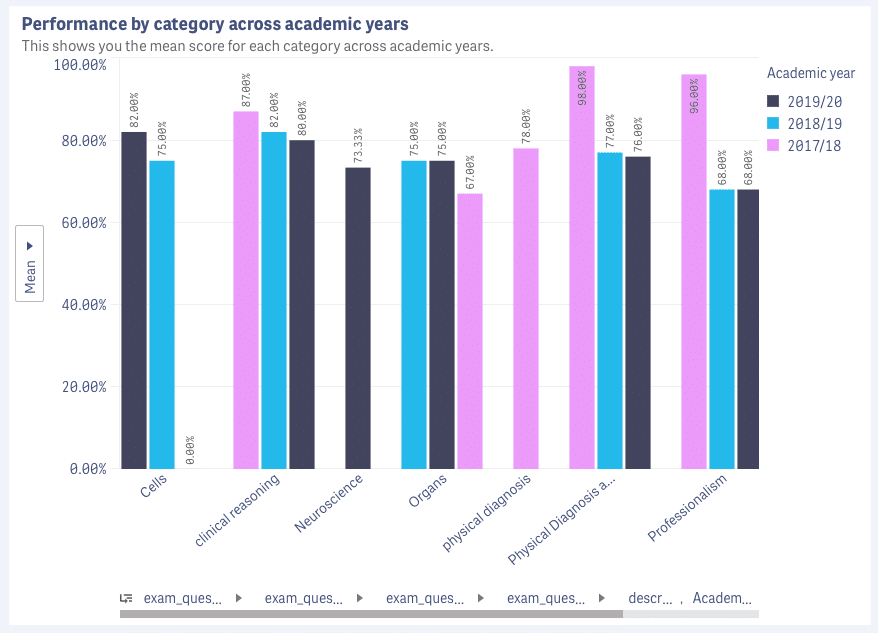
These detail-oriented dashboards also provide visualizations that let you look at your data across different dimensions. For example, if you are reviewing exam data, sometimes it is helpful to be able to compare results of one exam to another, or to compare the performance across years, or by category.
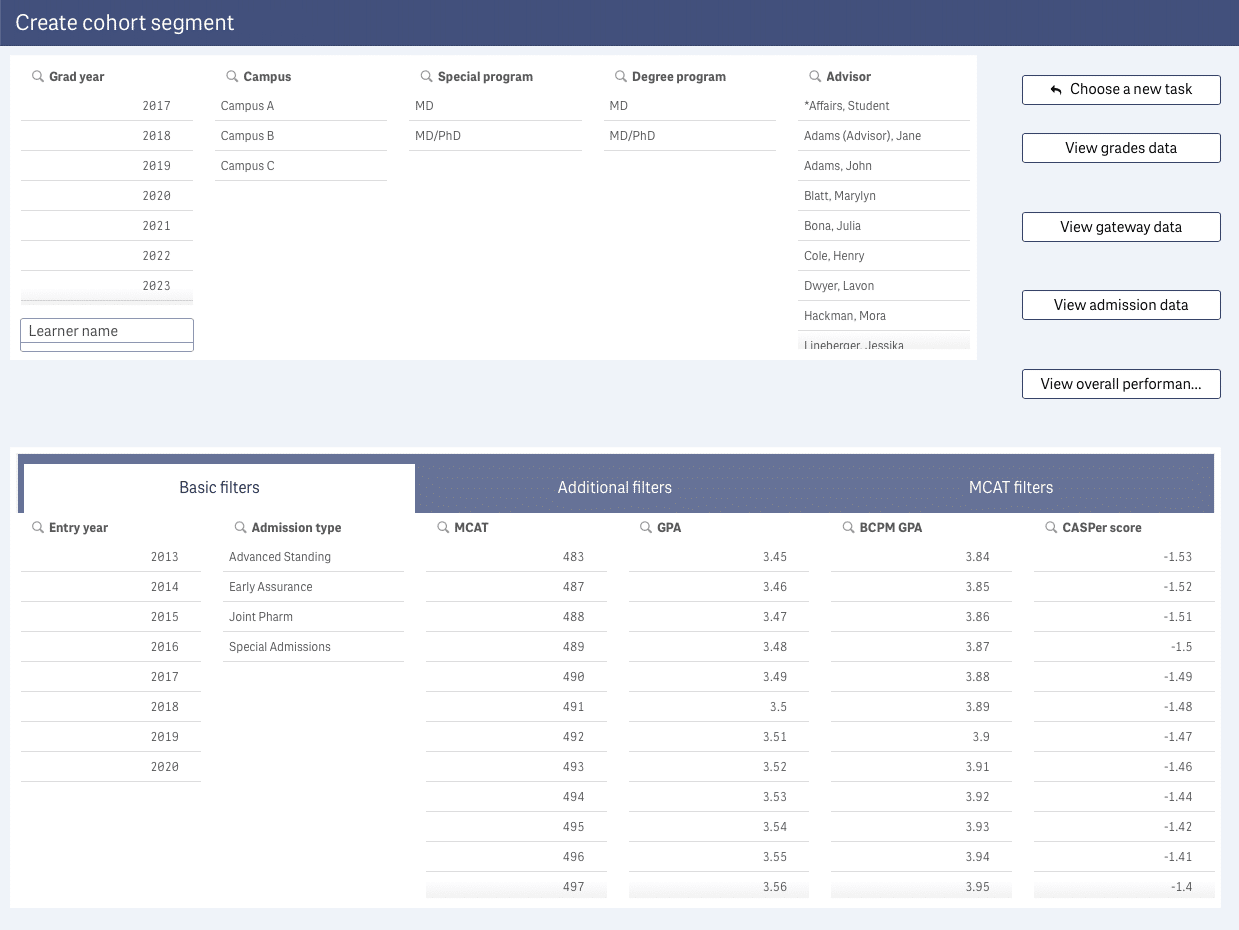
One of the secret weapons in Analytics that we have improved this year is the ability to segment data using any one of the hundreds of data dimensions in the system. If you’ve ever wondered how learners from a given admission program with an MCAT score in a certain range and an engineering degree compared with learners who matriculated last year, Analytics can help you answer that question.
You simply add filters to segment the population you’re interested in, and then review the data for that segment. If you want to revisit the segment in the future, you can create a bookmark that remembers the selections you made so you can get back to them again quickly later.
Find potentially struggling students
There are a couple of ways you can find low performers in Altus Analytics. If you do not already have a student in mind, the best place to start is with the View recent performance dashboard. Here you can see which learners have grades (broken out by formative and summative) that are below low performance or passing thresholds. You can see how many grades these students have that are low performing, and also review how far below the threshold those scores were.
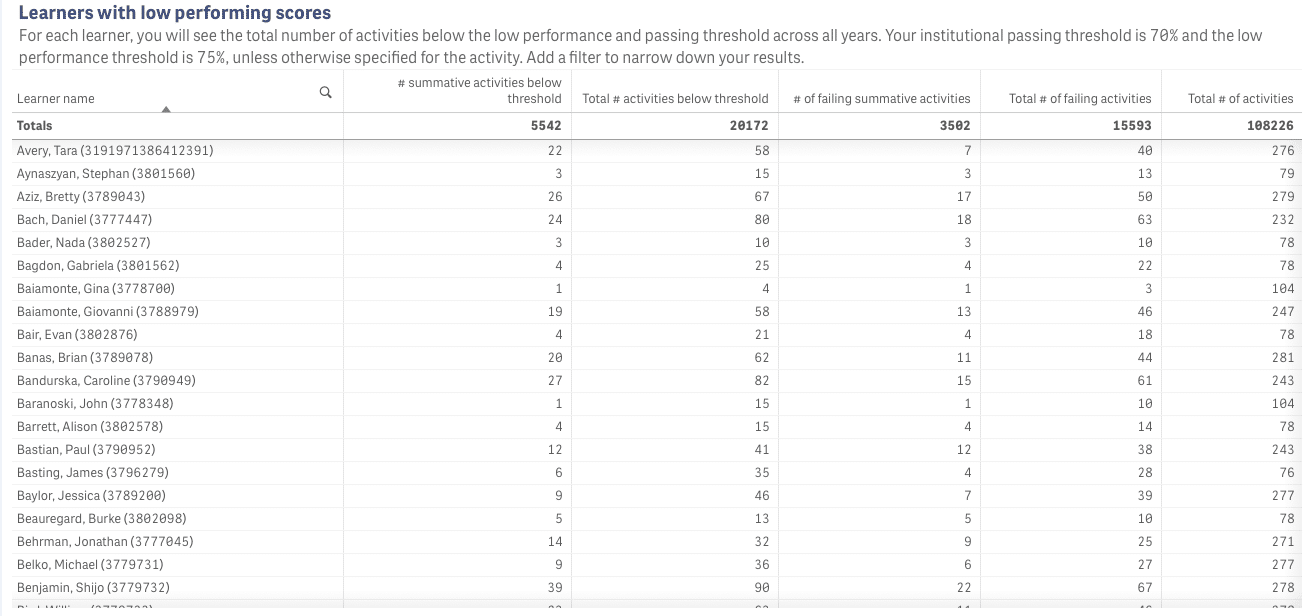
If you have a particular learner in mind, you can navigate to a student-based low performance dashboard from the learner review dashboard. This is convenient if you’re already in the process of reviewing a learner and want to dip in to review where they might have had some difficulty.
Export data for ad hoc analysis
Sometimes you need access to the data itself. Not a chart, or a fancy table with color-coded cells that compare the performance of the learner to their peers. Maybe you need the data for a research study you’re working on, or to share with a colleague. Whatever the case, sometimes you need the data in a format you can work with.
All of our visualizations support the ability to export their data to Excel. We have created tables for each type of data in Analytics that are designed for external analysis. These tables contain all of the fields you’ll need and include key or ID fields so that you can cross-link the exported data with other data sources for your work outside Analytics.
Where will 2021 take us?
That depends on you, our customers, and customers-to-be. All of the data sources and reporting improvements we added this year were the result of close collaboration with our customers. We have developed, iterated, and continued to iterate on solutions with our customers to help them make better use of the data they are collecting.
To achieve our vision and provide access to the data necessary to make positive changes to the learning experience provided by our customers, we will be adding more data integrations to Analytics and continuing to look for novel ways to present that data to tell the story of your institutions.
Related Articles

How interviews could be misleading your admissions...
Most schools consider the interview an important portion of their admissions process, hence a considerable…
Reference letters in academic admissions: useful o...
Because of the lack of innovation, there are often few opportunities to examine current legacy…
